Dashboards
Ask for the totals and the charts
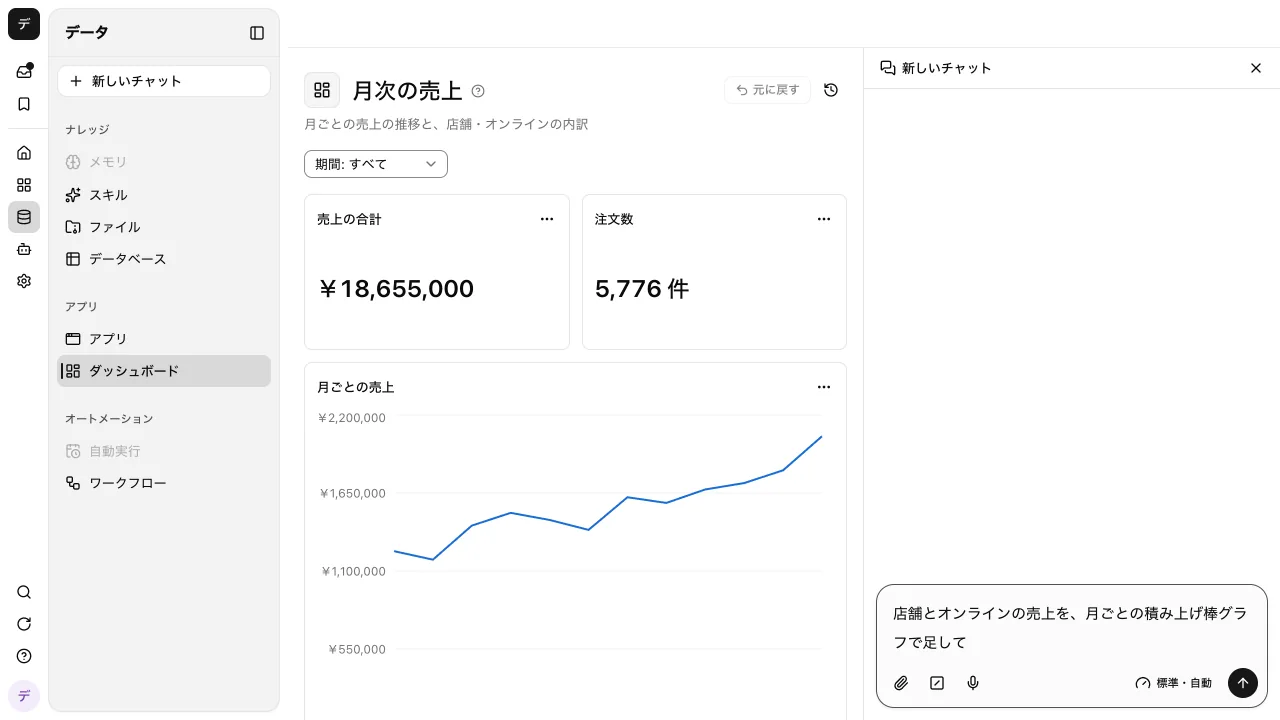
Ask "Chart monthly sales by rep" and the AI totals up the table and builds the dashboard panel. Even when the source lives in Google Sheets or Excel, a synced table keeps the numbers current on its own.
Open Samurai AppTry without signing upRequest materials
- How the work was done
- Where things are
Does reporting on numbers look like this?#
Rebuilding the same report every month
Every month you copy the sheet, fix the formulas, and redraw the charts.
BI tools are hard to set up
Connecting data and defining metrics takes know-how, so only a few people can touch them.
Reports drift from the source
The spreadsheet gets updated, but the report still shows last week's numbers.
Add and change panels by asking#
Open a new dashboard and a chat sits beside it. Number, chart (8 kinds), table, and note panels are laid out as you ask, and changes like "show amounts in thousands" go through chat too, each one saved as a version.
- Add period and category filters
- "View query" on a panel shows the SQL behind it
- Undo and version history take you back to an earlier layout
Start from Excel, CSV, or Google Sheets#
"Create from Excel or CSV" turns a file into a table and opens a dashboard over it. Tables can also sync with Google Sheets or Excel on OneDrive or SharePoint, refreshing every hour, 6 hours, or day.
- Panels reread their table within seconds of a change
- A panel says when its table's sync has paused
- Up to 20 synced tables per workspace
Only people who can read the table see the numbers#
A panel shows its numbers only to people who can read the source table; others see that they lack access. Table and chart panels export the current filtered result to CSV or Excel.
- Exports up to 50,000 rows
- Only the creator and admins rename or delete a dashboard, and deleting it keeps the tables
Frequently asked questions#
Do I need to know SQL or formulas?
No. Say in chat what you want totaled. The SQL used is shown under "View query" on each panel.
Do numbers from Google Sheets update on their own?
Yes, when the table is synced. Pick every hour, 6 hours, or day. The source sheet wins: edits made here are replaced at the next sync.
Can I make one inside a chat?
Yes. Ask in a chat and the dashboard opens beside the conversation. "Open in Dashboards" moves it to its own screen.
Which charts are available?
Eight: column, stacked column, bar, line, area, doughnut, scatter, and a combo of bars and a line. Number, table, and note panels can be added too.
Everyday work comes together, connects, and becomes the company's strength.